Rhode Island Crime Rate: Detailed Analysis and Key Insights
Have you ever wondered how safe it is to live in the smallest state in the United States? Rhode Island, known for its beautiful coastline and rich history, also boasts interesting facts about its public safety. Understanding the dynamics of crime in this state sheds light on the efforts made by law enforcement and justice officials to maintain peace.

The topic of crime here involves multiple layers, including violent offenses, property-related crimes, and the overall density of criminal activities. By diving into detailed crime statistics, one can grasp the effectiveness of Rhode Island’s approach to public safety and criminology. This article offers an investigative glimpse into these aspects, revealing insights that might surprise you and help paint a clear picture of crime trends and risks in Rhode Island.
- Rhode Island exhibits a lower crime rate compared to many states in the U.S.
- Crime analysis covers violent crime, property crime, and crime density metrics.
- Insightful crime statistics aid understanding of public safety and law enforcement effectiveness.
Comprehensive Crime Types in Rhode Island
In Rhode Island, crime is categorized mainly into violent crime and property crime. The total crimes reported reach 14,124, with the larger share belonging to property crimes. These property offenses include thefts, burglaries, and motor vehicle thefts, which collectively form a significant part of crime statistics. Violent crime, though fewer in number, involves serious issues such as murder, rape, robbery, and assault.
The crime rate per 1,000 residents stands at 12.89 overall, reflecting both categories together. These figures provide a foundational understanding of the safety challenges within the state and help guide public safety initiatives and law enforcement strategies aimed at reducing crime.
- Total crimes reported are 14,124 with majority being property crimes.
- Violent crimes constitute a smaller portion but include serious offenses like murder and assault.
- Crime rate per 1,000 residents stands at 12.89 overall.
| Crime Category | Total Cases Reported | Rate per 1,000 Residents |
|---|---|---|
| Total Crimes Reported | 14,124 | 12.89 |
| Violent Crime | 1,839 | 1.68 |
| Property Crime | 12,285 | 11.21 |
Detailed Violent Crime Data and Trends

Looking closely at Rhode Island’s violent crime sector reveals a rate of 1.68 incidents per 1,000 residents, which is notably lower than many parts of the country. Within this category, assaults are the most commonly reported type of offense, followed by cases of rape, robbery, and murder. Despite being the rarest, murder cases significantly impact public perception of safety and justice mechanisms.
The risk of a resident becoming a victim of violent crime in Rhode Island is about 1 in 596, highlighting the relatively safer environment compared with other states. These crime statistics underline the state’s ongoing efforts to protect its community through focused law enforcement and justice system responses.
- Violent crime rate is 1.68 per 1,000 residents, significantly below national median.
- Assaults account for the highest number of violent offenses.
- Chance of violent crime victimization in Rhode Island is 1 in 596.
| Violent Crime Type | Reported Cases | Rate per 1,000 Residents |
|---|---|---|
| Murder | 28 | 0.03 |
| Rape | 402 | 0.37 |
| Robbery | 241 | 0.22 |
| Assault | 1,168 | 1.07 |
Rhode Island Violent Crime Compared to National Averages
When comparing Rhode Island’s violent crime rates to the national averages, it becomes clear that this state maintains a safer environment in many respects. Rhode Island’s violent crime rate of 1.68 per 1,000 residents is well below the United States median rate of 4. Specific crimes like murder and assault follow this pattern, with Rhode Island’s figures consistently lower than national medians.
For example, the assault rate here is just 1.07 versus 2.64 nationally. These statistics indicate effective public safety strategies and crime prevention measures in place. Moreover, the state’s law enforcement agencies continuously work to keep these numbers low, supporting community well-being. For more detailed statistics and official data, visiting FBI resources such as FBI Uniform Crime Reporting can offer further insights.
| Crime Type | Rhode Island Rate | National Median Rate |
|---|---|---|
| Violent Crime | 1.68 | 4 |
| Murder | 0.03 | 0.06 |
| Rape | 0.37 | 0.38 |
| Robbery | 0.22 | 0.67 |
| Assault | 1.07 | 2.64 |
Insights into Property Crime in Rhode Island
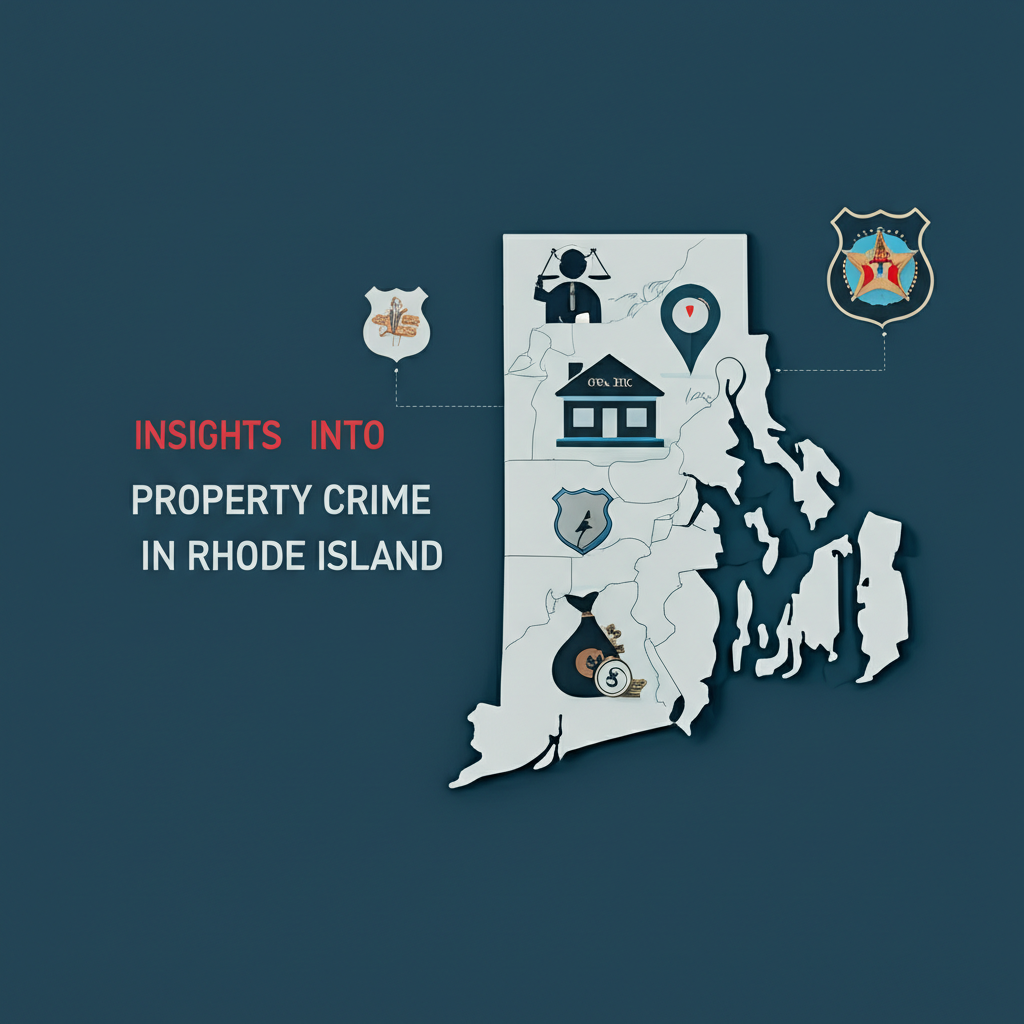
Property crime accounts for the majority of offenses committed in Rhode Island. Theft stands out as the most frequently reported property crime, affecting thousands of residents annually. Additionally, both burglary and motor vehicle theft contribute sizeable shares to property crime statistics. This distribution underscores the challenges in protecting homes, personal belongings, and vehicles.
Residents in the state face approximately a 1 in 89 chance of experiencing a property crime. Understanding these trends helps public safety officials to tailor prevention and educational campaigns aimed at reducing these incidents. The state continues to emphasize community engagement and smarter policing to address the needs of its population effectively.
- Property crimes represent the bulk of offenses, with theft being the most prevalent.
- Motor vehicle theft and burglary also contribute significantly to property crime stats.
- Rhode Island residents face a 1 in 89 chance of property crime victimization.
| Property Crime Type | Reported Cases | Rate per 1,000 Residents |
|---|---|---|
| Burglary | 1,297 | 1.18 |
| Theft | 9,452 | 8.62 |
| Motor Vehicle Theft | 1,536 | 1.40 |
Property Crime Rates Compared to National Statistics
When examining property crime rates, Rhode Island consistently ranks safer than the national average across several categories. For instance, burglary rates here are at 1.18 per 1,000 residents, less than half the national median of 2.51. Theft and motor vehicle theft rates follow the same trend, with Rhode Island’s numbers significantly below the median figures for the United States.
These differences highlight the relative safety of the state concerning property-related crimes and reflect positively on public safety measures and law enforcement practices. Residents and policymakers alike benefit from such comparisons as they inform community safety plans. Additional detailed statistics are available at the Bureau of Justice Statistics website, such as BJS Property Crime Data.
| Property Crime Type | Rhode Island Rate | National Median Rate |
|---|---|---|
| Burglary | 1.18 | 2.51 |
| Theft | 8.62 | 13.47 |
| Motor Vehicle Theft | 1.40 | 3.19 |
Crime Density: Crimes per Square Mile in Rhode Island
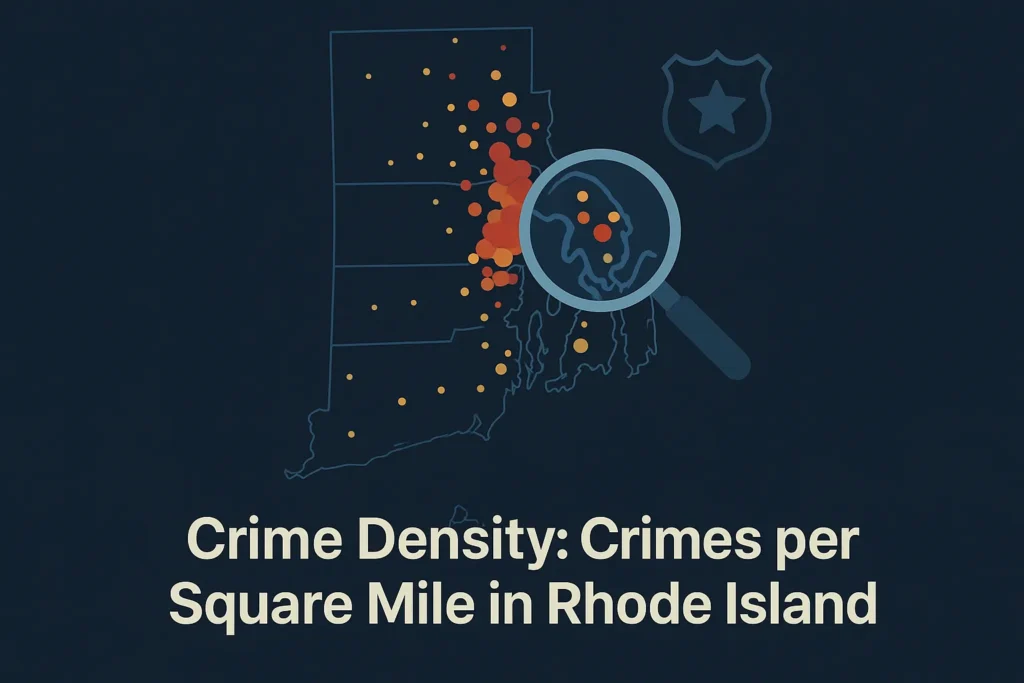
Measuring crime density, or the number of crimes occurring per square mile, offers important insights into how geography and population layout influence public safety challenges. Rhode Island reports 29 crimes per square mile, slightly exceeding the national median of 26.5. This higher density could be linked to Rhode Island’s small size combined with concentrated urban and suburban areas.
Law enforcement agencies use crime density data to plan resource deployment more strategically, ensuring that areas with higher incident rates receive adequate attention. This metric enhances understanding of spatial crime patterns, lending support to both prevention and rapid response efforts across the state.
- Rhode Island reports 29 crimes per square mile, slightly above the national median of 26.5.
- Higher crime density may reflect geographic and population distribution.
- Crime density metrics assist law enforcement planning and resource allocation.
| Location | Crimes per Square Mile |
|---|---|
| Rhode Island | 29 |
| National Median | 26.5 |
Top 10 Safest Cities in Rhode Island
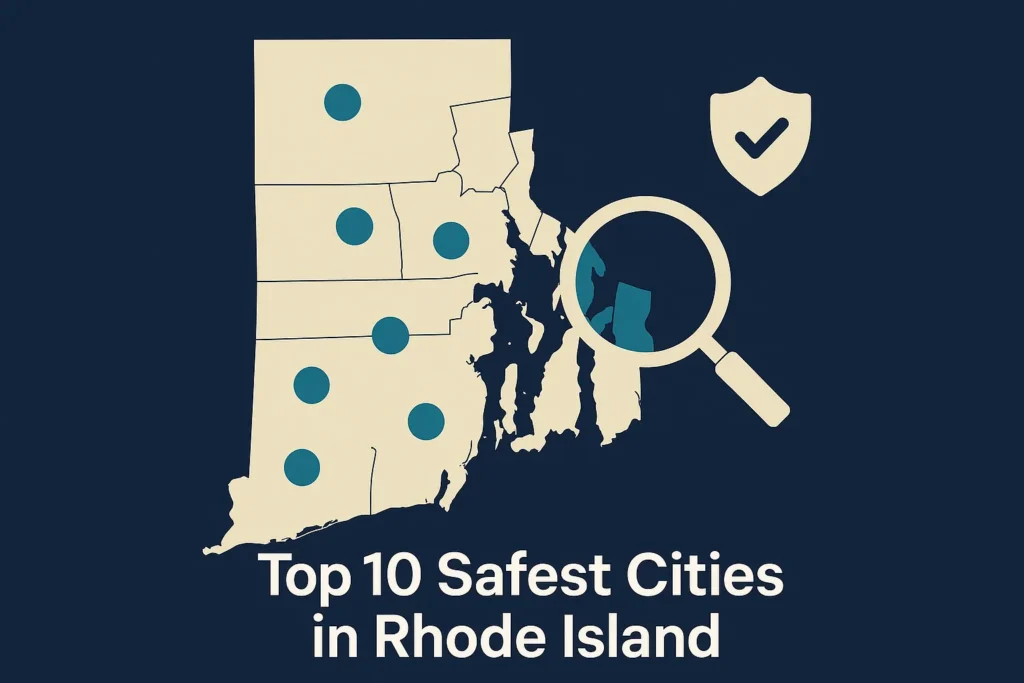
Safety within cities greatly influences residents’ daily lives and community trust. Among Rhode Island’s municipalities, the city of Scituate holds the top spot as the safest place to live. Following Scituate, cities like Bristol, Exeter, and Glocester are recognized for their low crime rates. This list of safest cities highlights towns where law enforcement and community efforts have successfully maintained peaceful environments. These areas not only benefit from crime prevention but also enjoy enhanced quality of life through increased public safety. As a result, they often attract families and individuals seeking secure communities to call home.
- Scituate ranks as the safest city in Rhode Island.
- Other cities with low crime include Bristol, Exeter, and Glocester.
- Safe cities contribute to community trust and quality of life.
| Rank | City |
|---|---|
| 1 | Scituate |
| 2 | Bristol |
| 3 | Exeter |
| 4 | Glocester |
| 5 | Foster |
| 6 | Burrillville |
| 7 | Little Compton |
| 8 | Hopkinton |
| 9 | Portsmouth |
| 10 | Richmond |
Popular Cities in Rhode Island and Crime Overview

Rhode Island’s population is spread among several popular cities, such as Providence, Warwick, and Pawtucket. These urban centers face distinct crime challenges influenced by demographic variety and urban density. Crime rates differ across these and other cities, reflecting the unique characteristics and needs of each community.
To maintain safety and public order, local law enforcement agencies are vigilant in monitoring trends and responding accordingly. Although detailed crime data might not be available for every city at this moment, ongoing efforts focus on transparency and community engagement to address concerns effectively and uphold public safety statewide.
- Major urban centers include Providence, Warwick, and Pawtucket.
- Crime rates vary across the state’s popular cities reflecting demographic diversity.
- Office of local law enforcement continuously monitors crime to maintain public order.
| City | Crime Data Availability |
|---|---|
| Coventry | [city_crime_row city=”Coventry” state=”Rhode Island”] |
| Cranston | [city_crime_row city=”Cranston” state=”Rhode Island”] |
| Cumberland | [city_crime_row city=”Cumberland” state=”Rhode Island”] |
| East Providence | [city_crime_row city=”East Providence” state=”Rhode Island”] |
| Johnston | [city_crime_row city=”Johnston” state=”Rhode Island”] |
| Newport | [city_crime_row city=”Newport” state=”Rhode Island”] |
| North Kingstown | [city_crime_row city=”North Kingstown” state=”Rhode Island”] |
| North Providence | [city_crime_row city=”North Providence” state=”Rhode Island”] |
| Pawtucket | [city_crime_row city=”Pawtucket” state=”Rhode Island”] |
| Providence | [city_crime_row city=”Providence” state=”Rhode Island”] |
| South Kingstown | [city_crime_row city=”South Kingstown” state=”Rhode Island”] |
| Warwick | [city_crime_row city=”Warwick” state=”Rhode Island”] |
| West Warwick | [city_crime_row city=”West Warwick” state=”Rhode Island”] |
| Westerly | [city_crime_row city=”Westerly” state=”Rhode Island”] |
| Woonsocket | [city_crime_row city=”Woonsocket” state=”Rhode Island”] |
Data Sources and Methodology for Rhode Island Crime Statistics

The crime data used to analyze Rhode Island’s safety records comes from a vast collection of reports submitted by roughly 18,000 local law enforcement agencies across the United States. This comprehensive data gathering ensures that statistics are as accurate and complete as possible. Each year, the latest data is updated, reflecting ongoing developments and trends.
A rigorous methodology supports these numbers, including a meta-analysis of millions of crime reports combined with geospatial data to cross-verify locations and details. This approach helps minimize errors and accounts for non-reporting cases. National statistical services like the Bureau of Justice Statistics maintain similar standards, contributing valuable insights for policymakers and public safety planners. More information is available at Bureau of Justice Statistics.
- Crime data is collected from approximately 18,000 local law enforcement agencies throughout the U.S.
- The statistics are updated annually with the latest comprehensive data analysis.
- Methodology includes meta-analysis of millions of reported crimes with geospatial data to ensure accuracy.
Conclusion
In conclusion, Rhode Island presents a complex but generally safer landscape when it comes to crime, compared to national averages. Cities like Providence, Pawtucket, and Woonsocket reflect the state’s efforts in addressing social issues and deviance through effective law enforcement and public services. The state’s approach to criminal justice, including penal imprisonment and sentencing, showcases a balance between punishment and reform, aiming for justice and public safety.
Despite challenges such as juvenile delinquency and property crimes, Rhode Island’s criminal law and society demonstrate a commitment to reducing misconduct and enhancing national security. The interplay between criminology, social policy, and human rights continues to shape the state’s strategies against crime, ensuring a focus on equality rights and the well-being of all residents.


