New Mexico Crime Rate: In-Depth Analysis and Statistical Review
Have you ever wondered why some states face more challenges with public safety than others? New Mexico is one such state where crime rates have sparked significant attention. Understanding the patterns of violent crime and property crime is crucial for grasping the state’s overall safety landscape. These patterns shed light on the complex social issues that influence problem behavior and the need for effective legal action.

Many residents and officials alike recognize how important it is to look closely at crime statistics to help improve law enforcement efforts and justice outcomes. Exploring these trends through the lens of criminology offers valuable insights into how violence impacts communities. As we delve into this analysis, you’ll discover key factors driving the state’s safety concerns and how they affect everyday lives. This comprehensive review aims to illuminate paths toward greater public safety and informed decision-making.
- New Mexico faces crime rates notably higher than national medians, highlighting critical public safety concerns.
- This overview provides essential insights into violent and property crimes affecting residents and communities.
- Understanding crime dynamics is vital for law enforcement, policy-making, and community awareness.
Comprehensive Crime Types and Statistics
To understand crime in New Mexico, it’s essential to explore the specific types and the numbers behind them. In total, the state reported over 76,000 crimes, a substantial figure reflecting ongoing challenges. Most of these offenses fall under property crime, including burglary, theft, and motor vehicle theft. Still, violent crime accounts for a significant share, with assault being the most common violent offense.
By examining the rate per 1,000 residents, we can better appreciate how these crimes affect local populations differently. This distinction between violent crime and property crime helps residents and policymakers gauge potential risks and prioritize public safety measures. The following table summarizes these critical figures, emphasizing how widespread and varied the criminal activity is across the state.
- Total crimes reported in New Mexico exceed 76,000 cases, with property crime comprising the majority.
- Violent crimes represent a significant share, with assaults being predominant within this category.
- Crime rates per 1,000 residents clearly differentiate violent from property crimes, indicating risk levels for residents.
| Crime Category | Total Cases Reported | Rate per 1,000 Residents |
|---|---|---|
| Total Crimes Reported | 76,896 | 36.37 |
| Violent Crime | 15,844 | 7.49 |
| Property Crime | 61,052 | 28.87 |
Detailed Violent Crime Data and Analysis

Violent crime in New Mexico is a pressing concern, marked by relatively high rates of offenses like assault and robbery when compared with other states. The chance of a resident experiencing violent crime is about 1 in 133, underscoring a tangible risk within communities. While murder and rape happen less frequently, these crimes still appear more often here than the national average, reflecting both social challenges and law enforcement demands.
The following table details each type of violent crime, highlighting where the state stands in terms of frequency and impact. Understanding these numbers helps to focus on those areas requiring enhanced public safety interventions and legal attention, especially regarding critical sex crimes and the legal aspects of death that cases involving murder entail.
- Violent crime in New Mexico includes high rates of assault and robbery relative to national averages.
- The likelihood of becoming a victim of violent crime is approximately 1 in 133 residents.
- Murder and rape rates, while lower than some other violent crimes, still exceed U.S. averages.
| Violent Crime Type | Reported Cases | Rate per 1,000 Residents |
|---|---|---|
| Murder | 244 | 0.12 |
| Rape | 1,114 | 0.53 |
| Robbery | 1,542 | 0.73 |
| Assault | 12,944 | 6.12 |
Violent New Mexico Crime Rates Compared to National Figures
Analyzing how violent crime in New Mexico stacks up against nationwide levels reveals critical insights. The state’s rates in this category are nearly double the national median, which raises questions about regional factors behind these numbers. In particular, assault stands out, recorded at more than twice the national rate.
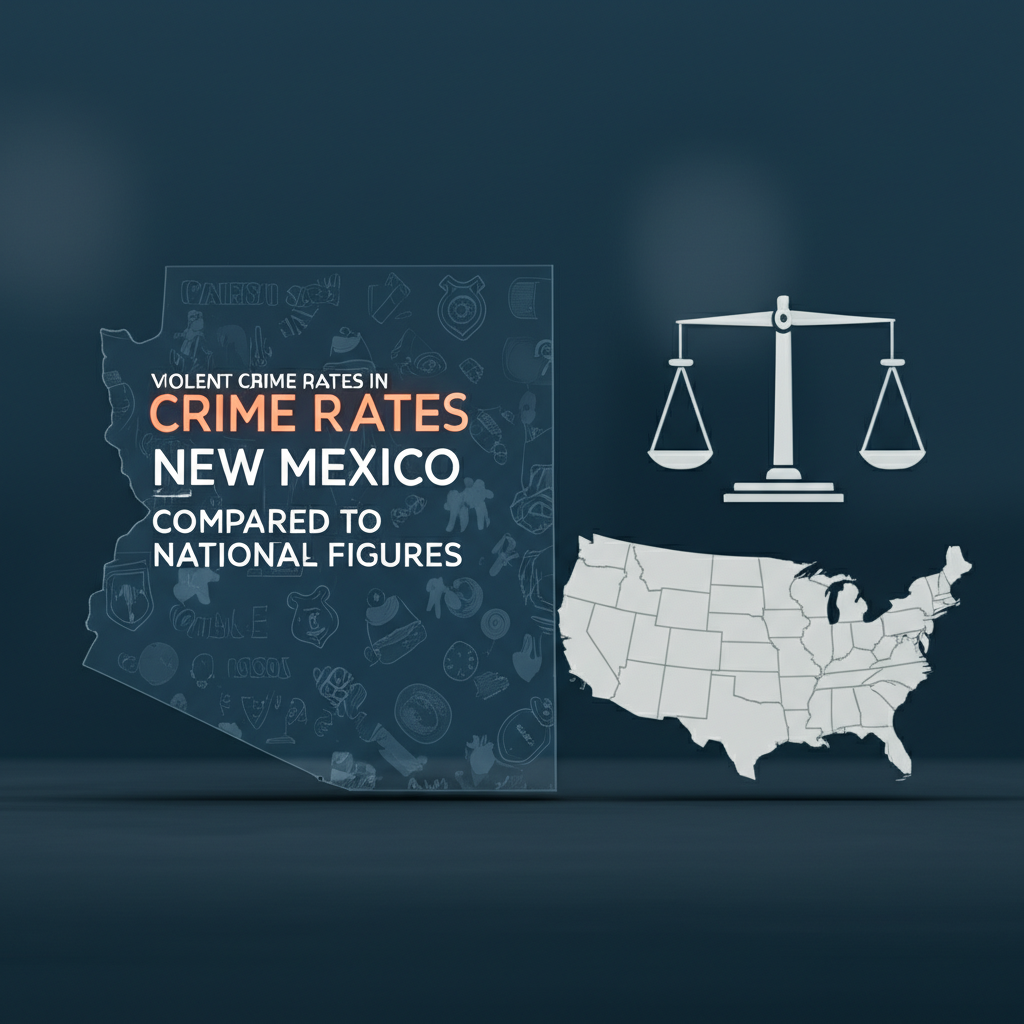
Such comparisons not only illustrate local challenges but also help inform resource allocation and national security discussions. A clear understanding of these disparities supports efforts by law enforcement and policymakers to target areas most in need. To see the differences laid out, the table below offers a direct comparison of New Mexico’s violent crime rates alongside national medians. For further details on national crime data, the FBI provides comprehensive resources at FBI Crime Data.
- New Mexico’s violent crime rates significantly surpass national medians.
- Assault rates are particularly elevated, more than double the U.S. median.
- Understanding these comparisons aids in evaluating state safety and resource needs.
| Crime Type | New Mexico Rate | National Median Rate |
|---|---|---|
| Violent Crime | 7.49 | 4.0 |
| Murder | 0.12 | 0.06 |
| Rape | 0.53 | 0.38 |
| Robbery | 0.73 | 0.67 |
| Assault | 6.12 | 2.64 |
Property Crime Insights and Data Metrics

When it comes to property crime, New Mexico faces considerable challenges. This category forms the bulk of offenses, with theft as the most reported crime type. Residents face a concerning chance of 1 in 35 of becoming victims, signaling notable security issues. Additionally, burglary and motor vehicle theft figures reveal ongoing vulnerabilities in protecting homes and vehicles. These elements create a complex picture of the state’s crime landscape, one where prevention and community vigilance remain crucial. The accompanying table details the frequency and risk exposure of these crimes per 1,000 residents, offering a grounded view of what many face daily in their neighborhoods.
- Property crime dominates reported offenses with theft being the most frequent incident.
- Residents face a relatively high chance (1 in 35) of becoming property crime victims.
- Burglary and motor vehicle theft statistics further underline significant security challenges.
| Property Crime Type | Reported Cases | Rate per 1,000 Residents |
|---|---|---|
| Burglary | 10,950 | 5.18 |
| Theft | 39,117 | 18.50 |
| Motor Vehicle Theft | 10,985 | 5.20 |
Property Crime Rates Relative to National Averages
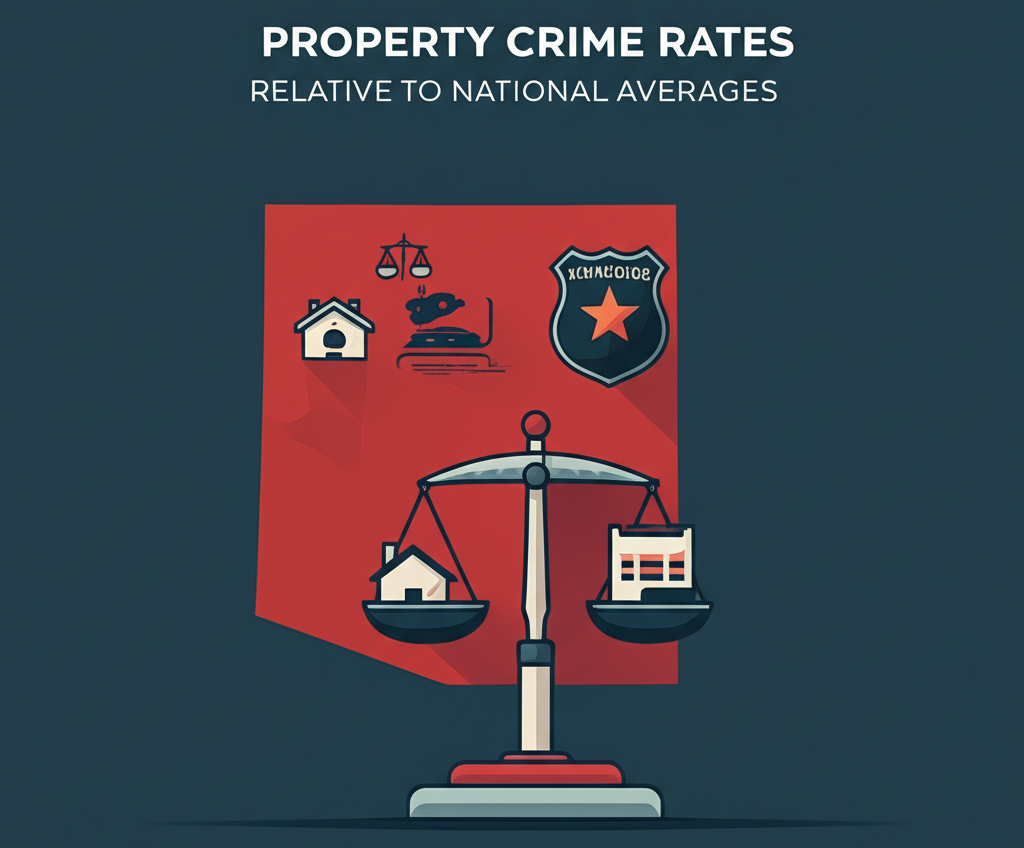
Comparing property crime rates in New Mexico with national medians highlights a persistent gap. The state’s rates are consistently higher across all major types, signaling an ongoing public safety challenge. For instance, both thefts and motor vehicle thefts notably surpass median U.S. values. These patterns emphasize the necessity for targeted crime prevention strategies and community engagement initiatives. By examining the data side-by-side, stakeholders can better understand where and how to concentrate efforts.
The table below presents a clear visual of New Mexico’s standing compared with other states, helping to guide informed discussions around security and law enforcement priorities. More details about comparative crime data can also be accessed through the Bureau of Justice Statistics at BJS Crime Data.
- New Mexico’s property crime rates consistently exceed U.S. median levels across all major categories.
- Thefts and motor vehicle thefts are notably higher, indicating specific areas requiring focused prevention efforts.
- Comparison tables help visualize the state’s property crime challenges against nationwide benchmarks.
| Property Crime Type | New Mexico Rate | National Median Rate |
|---|---|---|
| Burglary | 5.18 | 2.51 |
| Theft | 18.50 | 13.47 |
| Motor Vehicle Theft | 5.20 | 3.19 |
Crime Density: New Mexico’s Crimes Per Square Mile

In terms of crime density, which measures incidents per square mile, New Mexico presents an interesting case. The state records approximately 22 crimes per square mile, slightly below the national median of 26.5. This difference largely reflects New Mexico’s unique geographic and population distribution characteristics. Since communities are more spread out compared to more densely populated states, crime clusters differently.
These insights assist law enforcement in planning and deploying resources more strategically, ensuring efforts reach areas with greater need. Understanding how geographic factors affect the crime rate better equips officials to address challenges effectively while promoting public safety across wide and varied landscapes.
- New Mexico reports 22 crimes per square mile, which is below the national median density.
- Lower crime density reflects geographic and population distribution factors unique to the state.
- Tracking crimes per area assists law enforcement in strategic deployment of resources.
| Location | Crimes per Square Mile |
|---|---|
| New Mexico | 22 |
| National Median | 26.5 |
Safest Cities in New Mexico
Certain communities in New Mexico stand out for their exceptional safety records. Leading the list is Pie Town, noted for the lowest crime indicators statewide. Following closely are San Rafael and Lamy, which also boast impressively low crime levels. These cities exemplify environments where strong crime prevention and community safety efforts thrive. The benefits of being safe go beyond personal wellbeing, often encouraging local economic development and enhancing overall social wellbeing. The table that follows highlights the top ten safest cities, providing a snapshot of where peaceful and secure living is most achievable in New Mexico.
- Pie Town ranks as the safest city in New Mexico with the lowest crime indicators.
- Other top cities like San Rafael and Lamy also maintain remarkably low crime levels.
- Safe cities contribute to economic growth and improve residents’ quality of life.

| Rank | City |
|---|---|
| 1 | Pie Town |
| 2 | San Rafael |
| 3 | Lamy |
| 4 | Dora |
| 5 | Blanco |
| 6 | Hillsboro |
| 7 | Navajo Dam |
| 8 | Animas |
| 9 | Cubero |
| 10 | Stanley |
Popular Cities in New Mexico and Crime Overview
In contrast to the safest cities, popular urban centers in New Mexico face diverse and layered crime challenges. Cities such as Albuquerque, Santa Fe, and Las Cruces are examples where crime demands specific and adaptable law enforcement approaches. Due to variations in data availability, comprehensive crime figures are not always public for these locations.
However, understanding their unique urban crime landscapes is essential for officials working to enhance public safety. Tailored interventions based on local realities help address problems effectively. The table below lists many of these well-known cities, though it notes that detailed crime statistics may be limited or not provided at this time.
- Major urban centers present diverse crime challenges, requiring tailored law enforcement approaches.
- Data availability varies, but key cities include Albuquerque, Santa Fe, and Las Cruces among others.
- Understanding urban crime patterns helps policy makers target interventions effectively.
| City | Crime Data Availability |
|---|---|
| Alamogordo | [city_crime_row city=”Alamogordo” state=”New Mexico”] |
| Albuquerque | [city_crime_row city=”Albuquerque” state=”New Mexico”] |
| Carlsbad | [city_crime_row city=”Carlsbad” state=”New Mexico”] |
| Chaparral | [city_crime_row city=”Chaparral” state=”New Mexico”] |
| Clovis | [city_crime_row city=”Clovis” state=”New Mexico”] |
| Deming | [city_crime_row city=”Deming” state=”New Mexico”] |
| Farmington | [city_crime_row city=”Farmington” state=”New Mexico”] |
| Gallup | [city_crime_row city=”Gallup” state=”New Mexico”] |
| Hobbs | [city_crime_row city=”Hobbs” state=”New Mexico”] |
| Las Cruces | [city_crime_row city=”Las Cruces” state=”New Mexico”] |
| Los Lunas | [city_crime_row city=”Los Lunas” state=”New Mexico”] |
| Rio Rancho | [city_crime_row city=”Rio Rancho” state=”New Mexico”] |
| Roswell | [city_crime_row city=”Roswell” state=”New Mexico”] |
| Santa Fe | [city_crime_row city=”Santa Fe” state=”New Mexico”] |
| Sunland Park | [city_crime_row city=”Sunland Park” state=”New Mexico”] |
Data Collection Methodologies for Crime Reporting

Reliable crime data depends on rigorous data methodology. In New Mexico, information is gathered annually from thousands of law enforcement agencies. This process involves sophisticated techniques such as geocoding, which maps crimes to specific locations, and adjustments for instances when crimes go unreported.
Such measures strengthen the accuracy and completeness of official statistics, making them trustworthy resources for both the public and policymakers. Continual updates to these statistical data sets ensure that responses to crime remain current and effective. For those interested in exploring more about criminal data collection, the Bureau of Justice Statistics offers extensive insights at BJS Official Website.
- Crime data is aggregated annually from thousands of law enforcement agencies across New Mexico.
- The methodology incorporates geocoding and non-reporting adjustments to enhance accuracy.
- Regular updates ensure the reliability of crime statistics for public and policy use.
Conclusion: Addressing New Mexico’s Crime Challenges
In conclusion, the in-depth analysis of New Mexico’s crime statistics reveals a complex landscape of social issues, law enforcement challenges, and public safety concerns. The state’s higher-than-average rates of violent and property crimes underscore the need for comprehensive strategies that address the root causes of crime, including social policy, substance abuse, and gender-related violence. Efforts to enhance criminal justice, emergency services, and public law must be informed by accurate statistical data and a commitment to justice and human rights. By fostering interdisciplinary collaboration among social institutions, health care providers, and law enforcement agencies, New Mexico can work towards reducing crime rates and ensuring a safer future for all its residents.