Nevada Crime Rate 2025-: In-Depth Analysis and Comparative Statistics
Nevada is a state with complex challenges and efforts surrounding its public safety situation. Understanding Nevada and its crime dynamics is essential in appreciating how law enforcement agencies and the criminal justice system approach safety for residents and visitors alike.
Criminology studies and crime statistics provide vital clues that help officials identify trends and develop effective legal action and policies. Matters such as violent and property offenses interact with broader social issues and require interdisciplinary focus from experts in justice, law, and community outreach to reduce harm and improve outcomes throughout the state.
- Total crimes reported in Nevada stand at 93,709, reflecting the state’s public safety landscape.
- Violent and property crimes constitute the major categories influencing crime trends.
- Crime statistics are vital for law enforcement, criminology, and public policy decisions.

Comprehensive Crime Categories in Nevada
The state’s approach to tackling crime starts with clear categorization of offenses to guide law enforcement response and public awareness. Crime statistics reveal two primary groups shaping the safety landscape—violent crime and property crime. These two classifications encapsulate different impacts and require diverse strategies to address them. By analyzing how many cases fall under each, officials can distribute resources appropriately and measure improvements or emerging threats.
| Crime Category | Total Cases Reported | Rate per 1,000 Residents |
|---|---|---|
| Total Crimes Reported | 93,709 | 29.34 |
| Violent Crimes | 13,313 | 4.17 |
| Property Crimes | 80,396 | 25.17 |
Nevada’s Violent Crime Breakdown and Insights

Looking closely, violent crime in Nevada includes several serious offenses with differing severity and social implications. Of the 13,313 cases, there are 218 incidents of murder and over 9,200 cases of assault. Additionally, robbery accounts for 2,291 reports, while rape involves 1,582 occurrences, underscoring ongoing challenges in protecting citizens from physical and sexual violence.
The likelihood of anyone encountering violent crime is about 1 in 240 residents, a sobering reminder for community safety programs and criminal law enforcement. Understanding these divisions helps refine prevention measures and assists public safety officials in crafting targeted responses.
- Total violent crimes include 218 murders and over 9,200 assaults in Nevada.
- Robbery and rape cases stand at 2,291 and 1,582 incidents respectively.
- Risk of violent crime victimization is about 1 in 240 residents.
| Violent Crime Type | Reported Cases | Rate per 1,000 Residents |
|---|---|---|
| Murder | 218 | 0.07 |
| Rape | 1,582 | 0.50 |
| Robbery | 2,291 | 0.72 |
| Assault | 9,222 | 2.89 |
Violent Crime Comparison: Nevada vs. National Averages
When compared to the broader United States, Nevada’s violent crime rates show slightly higher figures in most categories. For example, the state’s murder rate is 0.07 per 1,000 residents, marginally above the national median of 0.06. Similarly, rape and robbery rates exceed the national median, at 0.50 and 0.72 versus 0.38 and 0.67 respectively. Even assault numbers remain somewhat elevated at 2.89 compared to 2.64 nationally.
Overall, Nevada’s violent crime rate registers at 4.17, slightly above the US median of 4.00. This information helps criminal justice professionals and public safety planners understand localized risks and allocate resources wisely. For the official national crime data, more details can be found at the FBI’s website: FBI UCR.
| Crime Type | Nevada Rate | National Median Rate |
|---|---|---|
| Murder | 0.07 | 0.06 |
| Rape | 0.50 | 0.38 |
| Robbery | 0.72 | 0.67 |
| Assault | 2.89 | 2.64 |
| Overall Violent Crime | 4.17 | 4.00 |
Insights into Property Crime in Nevada

An overwhelming majority of criminal incidents in Nevada fall under property crime. With over 80,000 cases reported, theft stands out as the most frequent crime, tallying nearly 46,000 incidents. Burglary and motor vehicle theft also contribute significantly to this category, making up thousands of cases each. The probability of falling victim to property crime here is approximately 1 in every 40 residents, a figure that urges ongoing attention to security measures. Understanding these patterns enables communities and officials to prioritize public safety through vigilance and preventive programs.
- Property crime dominates with over 80,000 reported incidents.
- Theft is the most widespread property crime at nearly 46,000 cases.
- The likelihood of property crime victimization is close to 1 in 40 residents.
| Property Crime Type | Reported Cases | Rate per 1,000 Residents |
|---|---|---|
| Burglary | 12,797 | 4.01 |
| Theft | 45,902 | 14.37 |
| Motor Vehicle Theft | 21,697 | 6.79 |
Property Crime Rates: Nevada Compared to U.S. Median
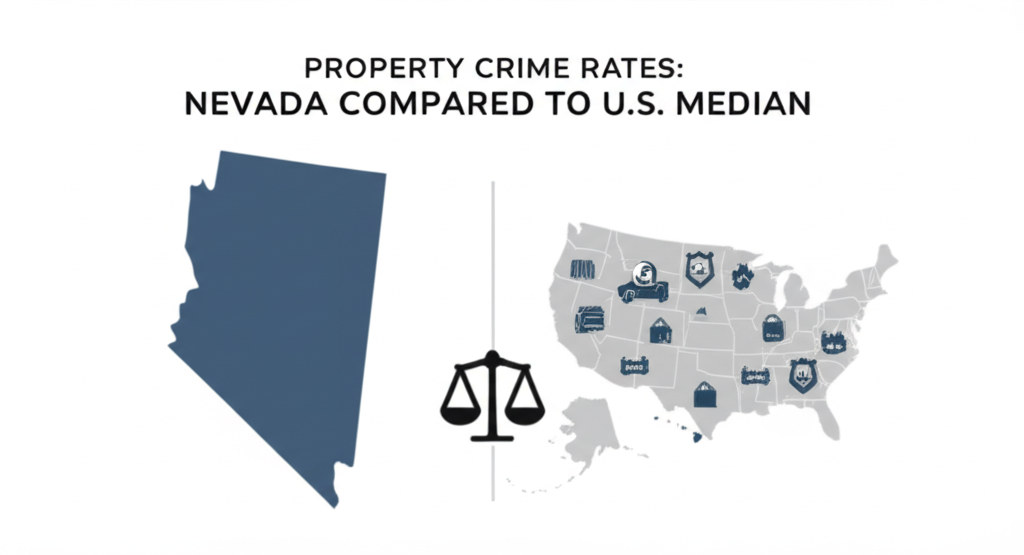
Placing property crime rates side by side with national medians reveals how Nevada compares in various offense types. The state’s burglary rate is considerably higher than the US median, registering 4.01 as opposed to 2.51. Theft rates are marginally higher at 14.37 compared to 13.47 nationally. The most striking difference appears in motor vehicle theft, where Nevada’s rate of 6.79 nearly doubles the national median of 3.19.
These gaps underscore ongoing challenges for public safety and underscore why tailored preventative strategies are necessary. For additional insights into property crime trends across the country, resources such as the Bureau of Justice Statistics provide valuable context: BJS Crime Data.
| Property Crime Type | Nevada Rate | National Median Rate |
|---|---|---|
| Burglary | 4.01 | 2.51 |
| Theft | 14.37 | 13.47 |
| Motor Vehicle Theft | 6.79 | 3.19 |
Crime Density by Geographic Area in Nevada

Examining crime density in relation to geographic size provides useful understanding about how evenly or sharply crime rate is distributed. Nevada’s rate stands at 23 crimes per square mile, which is slightly lower than the national median of 26.5. This measurement considers both urbanization and population spread, offering law enforcement crucial information for resource allocation and patrol planning. Such data is instrumental in optimizing public safety efforts and developing targeted surveillance or community programs.
| Location | Crimes per Square Mile |
|---|---|
| Nevada | 23 |
| National Median | 26.5 |
Top Safest Cities in Nevada with Crime Rate Data

Certain cities in Nevada exhibit notably low crime rates, setting examples for community safety and effective crime prevention. Blue Diamond emerges as the safest city, followed by places like Gerlach, Golconda, and Paradise Valley. These communities benefit from strong local relationships, proactive policing, and engaged residents. Such environments not only reduce violence but also promote a better quality of life through trust and stability. Highlighting these safe havens can guide future policies aiming to replicate their success elsewhere in the state.
- Blue Diamond tops the list as the safest city in Nevada.
- Other low crime cities include Gerlach, Golconda, and Paradise Valley.
- Safe cities foster community trust, better quality of life, and reduced violence.
| Rank | City |
|---|---|
| 1 | Blue Diamond |
| 2 | Gerlach |
| 3 | Golconda |
| 4 | Paradise Valley |
| 5 | Gabbs |
| 6 | Yerington |
| 7 | Silver City |
| 8 | Austin |
| 9 | Zephyr Cove – Glenbrook |
| 10 | Wellington |
Popular Cities in Nevada and Crime Data Overview
Nevada is home to many vibrant urban centers whose crime data plays a crucial role in understanding statewide safety. Cities such as Las Vegas, Reno, and Henderson are well-known but currently have limited publicly available crime statistics. This lack complicates detailed social research and requires reliance on state-level or national trends to assess conditions. Urban areas bring challenges related to population density and demographics, but with focused efforts, safety improvements are achievable.
| City | Crime Data Availability |
|---|---|
| Boulder City | [city_crime_row city=”Boulder City” state=”Nevada”] |
| Carson City | [city_crime_row city=”Carson City” state=”Nevada”] |
| Dayton | [city_crime_row city=”Dayton” state=”Nevada”] |
| Elko | [city_crime_row city=”Elko” state=”Nevada”] |
| Fallon | [city_crime_row city=”Fallon” state=”Nevada”] |
| Fernley | [city_crime_row city=”Fernley” state=”Nevada”] |
| Henderson | [city_crime_row city=”Henderson” state=”Nevada”] |
| Las Vegas | [city_crime_row city=”Las Vegas” state=”Nevada”] |
| Mesquite | [city_crime_row city=”Mesquite” state=”Nevada”] |
| North Las Vegas | [city_crime_row city=”North Las Vegas” state=”Nevada”] |
| Pahrump | [city_crime_row city=”Pahrump” state=”Nevada”] |
| Reno | [city_crime_row city=”Reno” state=”Nevada”] |
| Sparks | [city_crime_row city=”Sparks” state=”Nevada”] |
| Spring Creek | [city_crime_row city=”Spring Creek” state=”Nevada”] |
| Sun Valley | [city_crime_row city=”Sun Valley” state=”Nevada”] |
Crime Data Collection and Analytical Methodology

Reliable insights into crime data in Nevada and across the nation stem from comprehensive and systematic collection methods. Data is gathered from more than 18,000 local law enforcement agencies, capturing reported crimes with detailed geographic tagging. This ensures thorough representation and clarity about where incidents occur.
The yearly updates allow for tracking trends and emerging patterns to inform criminology research, law enforcement strategy, and public policy. The official nature of these statistical data sets supports accurate analysis and confidence in the results, as described by national statistical services such as the Bureau of Justice Statistics available at BJS.
- Crime data collected from over 18,000 local law enforcement agencies nationwide.
- Data reflects reported crimes with geospatial tagging for detailed analysis.
- Annual updates ensure relevance and accuracy in crime reporting and trends.
Conclusion
The in-depth analysis of Nevada crime rate reveals a complex interplay between violent and property crimes, social issues, and law enforcement efforts. With violent crimes such as murder, rape, robbery, and assault, and property crimes including burglary, theft, and motor vehicle theft, Nevada faces significant challenges in ensuring public safety.
The state’s crime statistics, slightly above national averages in several categories, highlight the need for targeted interventions and community engagement to address these issues. Law enforcement and criminal justice systems play pivotal roles in mitigating these challenges, supported by criminology research and public policy.
The disparities in crime rates across different geographic areas and cities within Nevada underscore the importance of localized strategies and the potential for safer communities to serve as models for crime prevention. Ultimately, addressing the root causes of crime, from social inequalities to issues in ethics and justice, is essential for reducing crime rates and enhancing the quality of life for all Nevada residents.