Nebraska Crime Rate: Comprehensive Analysis and Insights
Have you ever wondered how safe Nebraska really is? When it comes to understanding crime in Nebraska, a closer look at the facts reveals a story influenced by many social and legal factors. This state, known for its blend of urban and rural areas, experiences unique crime statistics that reflect its distinctive environment.
Looking at Nebraska’s crime patterns offers a valuable gateway into the workings of law enforcement, the criminal justice system, and efforts to maintain public safety. It also touches on deeper social issues and the pursuit of justice within the community. Exploring the trends invites questions about how the state responds to criminology challenges and engages in legal action to protect its residents.
As we move forward, we will unravel the layers of Nebraska’s crime landscape and uncover insights that shed light on the balance between risk and security across the state.
- Nebraska’s overall crime rate reflects unique regional safety dynamics.
- Analyzing crime types provides essential insights for law enforcement and public safety efforts.
- Crime statistics help policymakers, researchers, and the public understand social issues and justice concerns.
Overview of Crime Types in Nebraska
Nebraska records a wide array of crime incidents annually, totaling 43,639 reported cases. These offenses broadly group into violent crime and property crime, with property crimes dominating the figures. While the number of violent crimes is smaller, their impact on public safety remains critical. Delving into these categories provides a clearer view of how Nebraska’s law enforcement agencies prioritize and allocate resources. The state’s approach, informed by crime statistics and principles of criminology, focuses on both prevention and intervention within its criminal law framework. Understanding the balance between these crime types is essential for developing effective strategies that enhance community safety and reduce harm.
- Total crimes reported amount to 43,639 incidents in Nebraska.
- Violent crimes make up a smaller but critical portion compared to property crimes.
- Understanding the distribution aids in targeted crime prevention and resource allocation.
| Crime Category | Total Cases Reported | Rate per 1,000 Residents |
|---|---|---|
| Total Crimes Reported | 43,639 | 22.06 |
| Violent Crime | 4,545 | 2.30 |
| Property Crime | 39,094 | 19.76 |
Detailed Violent Crime Statistics in Nebraska
When exploring violent crime within Nebraska, the numbers reveal that out of 4,545 incidents, assault is the most frequently reported offense. This category often involves confrontations leading to physical harm, significantly affecting victims and communities. Although the number of murder cases remains low at 64, this crime’s severity cannot be overstated. Rape and robbery also comprise important parts of the violent crime spectrum, presenting ongoing challenges for both survivors and authorities.
Statistically, the chance of being a victim of any violent crime in Nebraska stands at about 1 in 435, emphasizing the continuous need for proactive safety measures and effective legal action. These figures help shape policies and programs aimed at mitigating violence and protecting the public from harm.
- Violent crime totals 4,545 incidents with assault as the most frequent offense.
- Murder is the least common but most severe violent crime in Nebraska.
- Residents face a 1 in 435 chance of becoming a violent crime victim.
| Violent Crime Type | Reported Cases | Rate per 1,000 Residents |
|---|---|---|
| Murder | 64 | 0.03 |
| Rape | 957 | 0.48 |
| Robbery | 520 | 0.26 |
| Assault | 3,004 | 1.52 |
Nebraska Violent Crime Rates Compared to National Medians
Reviewing Nebraska’s violent crime rates alongside national statistics offers useful perspective on the state’s safety profile. The violent crime rate here is notably lower than the median rate across the United States. In particular, the murder rate in Nebraska is half that of the national median, which underlines a relatively low occurrence of homicides. Meanwhile, rates of robbery and assault also fall beneath national medians, indicating fewer incidents of these crimes compared to many other states.
However, the rate of rape in Nebraska slightly exceeds the national average, highlighting an area of concern for law enforcement and public safety officials. These comparisons help direct focused attention where it is most needed and support ongoing efforts to improve national security at the local level. For more detailed national crime reporting, visit the FBI’s official site at https://www.fbi.gov/services/cjis/ucr.
- Nebraska’s violent crime rate is lower than the U.S. median.
- Murder rate in Nebraska is half the national median rate, indicating relatively low homicide incidents.
- Robbery and assault rates remain below national medians, though rape rate is slightly above average.
| Crime Type | Nebraska Rate | National Median Rate |
|---|---|---|
| Murder | 0.03 | 0.06 |
| Rape | 0.48 | 0.38 |
| Robbery | 0.26 | 0.67 |
| Assault | 1.52 | 2.64 |
Insights on Property Crime in Nebraska
The majority of criminal offenses in Nebraska relate to property crime. These crimes encompass a broad range of illegal acts including theft, burglary, and motor vehicle theft. Among these, theft stands out as the most prevalent, with a significant volume of cases reported annually. Interestingly, while burglary rates remain within manageable levels, the state experiences elevated rates of motor vehicle theft.
This trend signals specific challenges regarding vehicle security in certain regions. Understanding these patterns aids in developing targeted interventions to safeguard assets and enhance overall public safety. Measures such as community awareness programs and improved security systems are vital parts of addressing these concerns effectively.
- Property crimes constitute the majority of reported offenses.
- Theft is overwhelmingly the most common property crime in Nebraska.
- Motor vehicle theft rates exceed the national average, signaling specific security challenges.
| Property Crime Type | Reported Cases | Rate per 1,000 Residents |
|---|---|---|
| Burglary | 3,353 | 1.69 |
| Theft | 27,490 | 13.90 |
| Motor Vehicle Theft | 8,251 | 4.17 |
Comparison of Property Crime Rates: Nebraska vs National Data
Putting Nebraska’s property crime numbers side by side with national figures reveals several important insights. The state’s burglary rate is lower than the national median, which may suggest effective security measures in residential areas and vigilant community watching. On the other hand, theft rates in Nebraska slightly surpass the national average, pointing to vulnerabilities particularly in preventing larceny.
A more pressing issue lies in motor vehicle theft, where Nebraska ranks noticeably higher than the median for the nation. This disparity highlights the need for focused efforts on vehicle protection and law enforcement strategies tailored to local circumstances. Such comparative analysis is essential for amplifying public safety and refining prevention tactics throughout the state.
- Nebraska’s burglary rate is below the national median, suggesting effective residential security.
- Theft rates are slightly above the national average, reflecting vulnerability to larceny.
- Higher motor vehicle theft rates highlight concerns for vehicle security in Nebraska.
| Property Crime Type | Nebraska Rate | National Median Rate |
|---|---|---|
| Burglary | 1.69 | 2.51 |
| Theft | 13.90 | 13.47 |
| Motor Vehicle Theft | 4.17 | 3.19 |
Crime Density Per Square Mile in Nebraska
When considering how densely crime is spread across Nebraska, the state experiences about 16 crimes per square mile. This figure is comfortably below the national median of 26.5, reflecting Nebraska’s more rural and less densely populated nature compared to many other parts of the country.
This lower crime density means that police and law enforcement resources can often be distributed with a focus on specific hotspots rather than overwhelming urban centers. Such data supports tactical decisions in public safety and prioritizes deployment where criminology research indicates the greatest need. Understanding crime density also helps communities appreciate how their local environment compares within the larger context of U.S. crime rates.
- Nebraska experiences 16 crimes per square mile, below the national median of 26.5.
- Lower crime density reflects Nebraska’s lower urban concentration compared to many U.S. states.
- Crime density metrics aid law enforcement in resource allocation and operational planning.
| Location | Crimes per Square Mile |
|---|---|
| Nebraska | 16 |
| National Median | 26.5 |
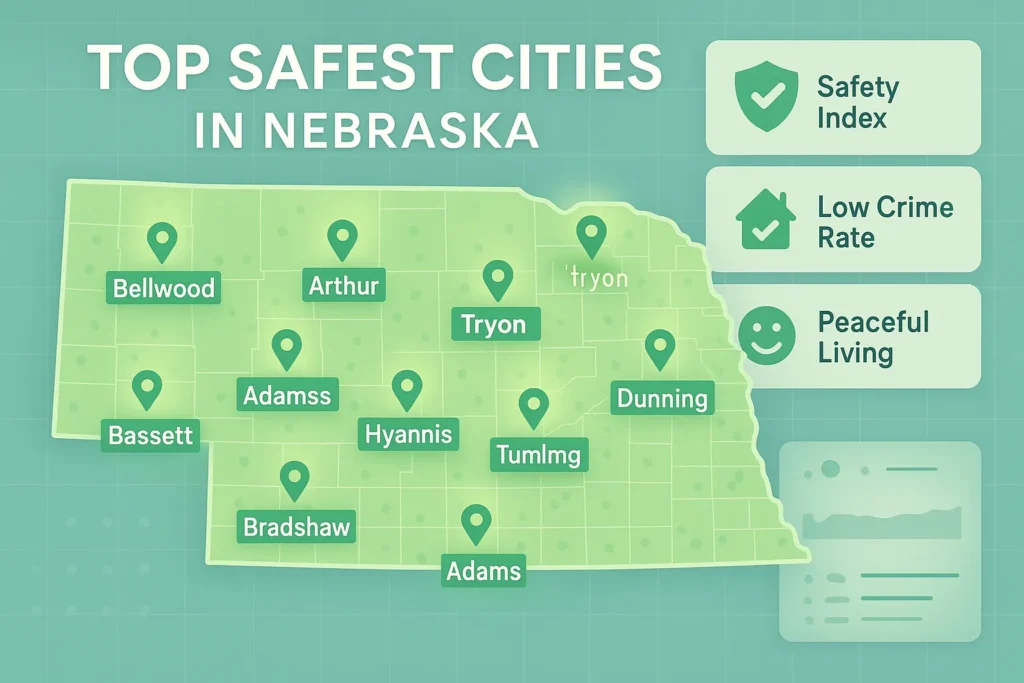
Top Safest Cities in Nebraska
Identifying the safest places in Nebraska reveals a number of cities where public safety stands out. Bellwood holds the top rank as the state’s safest city, marked by remarkably low crime rates. Other communities such as Arthur, Atkinson, and Bassett consistently report fewer offenses and robust interest in crime prevention.
These safety rankings serve multiple purposes, informing residents, helping prospective movers make decisions, and encouraging local authorities to continue fostering community safety. With stability in these cities, social cohesion and quality of life often flourish, showcasing how successful collaborative efforts can maintain low crime environments.
- Bellwood ranks as the safest city in Nebraska.
- Other cities known for low crime include Arthur, Atkinson, and Bassett.
- Safety rankings inform community decision-making and promote social stability.
| Rank | City |
|---|---|
| 1 | Bellwood |
| 2 | Arthur |
| 3 | Atkinson |
| 4 | Bassett |
| 5 | Adams |
| 6 | Hyannis |
| 7 | Talmage |
| 8 | Dunning |
| 9 | Tryon |
| 10 | Bradshaw |
Popular Cities in Nebraska and Crime Reporting
Popular cities in Nebraska like Omaha, Lincoln, and Bellevue bring their own sets of crime challenges shaped largely by their population sizes and urban complexities. These areas face a variety of offenses that reflect the dynamic mix of residents and economic activities.
However, the availability of detailed crime data from these urban centers varies, which can limit the breadth of comparative law enforcement and social research analyses. Despite these challenges, ongoing tracking of crime trends helps authorities adjust their approaches, tailoring prevention and enforcement strategies to the evolving nature of urban safety needs.
- Popular cities face diverse crime challenges influenced by population and urban dynamics.
- Data availability varies, impacting detailed comparative crime analysis.
- Ongoing crime tracking assists in tailored law enforcement approaches to urban safety.
| City | Crime Data Availability |
|---|---|
| Bellevue | [city_crime_row city=”Bellevue” state=”Nebraska”] |
| Columbus | [city_crime_row city=”Columbus” state=”Nebraska”] |
| Elkhorn | [city_crime_row city=”Elkhorn” state=”Nebraska”] |
| Fremont | [city_crime_row city=”Fremont” state=”Nebraska”] |
| Grand Island | [city_crime_row city=”Grand Island” state=”Nebraska”] |
| Hastings | [city_crime_row city=”Hastings” state=”Nebraska”] |
| Kearney | [city_crime_row city=”Kearney” state=”Nebraska”] |
| La Vista | [city_crime_row city=”La Vista” state=”Nebraska”] |
| Lincoln | [city_crime_row city=”Lincoln” state=”Nebraska”] |
| Norfolk | [city_crime_row city=”Norfolk” state=”Nebraska”] |
| North Platte | [city_crime_row city=”North Platte” state=”Nebraska”] |
| Omaha | [city_crime_row city=”Omaha” state=”Nebraska”] |
| Papillion | [city_crime_row city=”Papillion” state=”Nebraska”] |
| Scottsbluff | [city_crime_row city=”Scottsbluff” state=”Nebraska”] |
| South Sioux City | [city_crime_row city=”South Sioux City” state=”Nebraska”] |
Crime Data Collection and Methodology in Nebraska
The collection and analysis of crime data in Nebraska are part of a comprehensive national effort. This process draws upon information submitted by some 18,000 local law enforcement agencies across the United States, including those in Nebraska. Every year, this dataset undergoes meticulous updating to maintain accuracy and relevance, supporting key policy decisions and academic criminology research.
The methodology incorporates a meta-analysis of millions of reported crimes, complete with geographic precision down to specific locations. To enhance trustworthiness, statistical adjustments factor in underreporting and potential errors. Through these rigorous procedures, Nebraska’s official statistics provide a reliable foundation for understanding and addressing crime statewide. For more details about data methodology and statistics, the Bureau of Justice Statistics offers comprehensive resources at https://www.bjs.gov/.
- Data is collected from approximately 18,000 local law enforcement agencies across the U.S., including Nebraska.
- Annual updates ensure data accuracy and relevancy for policy and research.
- The methodology includes a meta-analysis of millions of reported crimes with geographic precision.
- Adjustments compensate for underreporting and reporting errors to produce trusted statistics.
Conclusion
In wrapping up our comprehensive analysis of Nebraska crime rate, it’s clear that the state presents a mixed picture of safety and challenges. While Nebraska enjoys lower rates of violent crime compared to the national median, certain areas, such as sexual violence and motor vehicle theft, demand heightened attention. The interplay between law enforcement, criminal justice, and community engagement plays a pivotal role in addressing these issues.
Nebraska’s approach to crime prevention and public safety, informed by criminology and social research, underscores the importance of tailored strategies that consider the unique dynamics of both urban and rural communities. As we move forward, the continued collection and analysis of crime statistics will be vital in shaping policies that enhance justice, reduce misconduct, and safeguard the well-being of all Nebraskans.