South Carolina Crime Rate: In-Depth Analysis and Statistical Breakdown
Have you ever wondered how safe South Carolina really is? Crime shapes the daily experiences of many residents. It affects everything from how people feel walking in their neighborhoods to how law enforcement plans their efforts. South Carolina faces various challenges related to crime statistics, including violence, social issues, and the demands on the criminal justice system.
Understanding these aspects is crucial for improving public safety and ensuring security and safety across the state. From how law enforcement tackles offenses to the decisions driving legal action and justice, every part of society plays a role. Exploring the facts and figures that define South Carolina’s crime landscape offers insight into ongoing efforts and the road ahead. Keep reading to uncover a detailed story backed by numbers and analysis.
Comprehensive Crime Overview in South Carolina
Looking at the full picture of crimes reported in South Carolina reveals important patterns. Crime in the state includes both violent crime and property crime, each affecting communities in different ways. The overall crime rate paints a picture that helps law enforcement and policymakers focus on what matters most for public safety. With a total of 143,158 incidents reported, South Carolina’s numbers reflect complex challenges tied to criminal law and persistent social issues that the community must navigate. Understanding the balance between violent offenses and property-related crimes is essential for effective prevention and response.
| Crime Category | Total Crimes Reported | Rate per 1,000 Residents |
|---|---|---|
| Total Crimes Reported | 143,158 | 26.64 |
| Violent Crime | 25,312 | 4.71 |
| Property Crime | 117,846 | 21.93 |
Detailed Breakdown of Violent Crime
Exploring the details of violent crime in South Carolina shows a mix of offense types that impact residents differently. The state’s violent crime rate sits slightly above the national median, indicating that assault cases make up the largest share of incidents. Residents face a 1 in 212 chance of experiencing violent crime, a sobering reality that influences community trust and criminology research.
Among violent crimes, murder is the least common but most severe. Sexual violence, including rape, also contributes notably to the figures and calls for heightened attention from both law enforcement and social programs. Robbery adds another dimension, often tied to economic and social causes. Understanding these varied forms equips those working in justice to design targeted responses that protect citizens effectively.
| Violent Crime Type | Reported Cases | Rate per 1,000 Residents |
|---|---|---|
| Murder | 482 | 0.09 |
| Rape | 1,958 | 0.36 |
| Robbery | 2,108 | 0.39 |
| Assault | 20,764 | 3.86 |
Violent Crime Rate Comparison: South Carolina vs National Average
When comparing South Carolina’s violent crime rates to the national averages, some interesting differences emerge. The murder rate in the state is somewhat higher than the national median, reflecting critical challenges in this category. In contrast, rates for rape and robbery are lower than the broader United States, yet assault cases are notably more frequent.
These comparisons help frame the state’s safety within the context of national public safety standards and guide criminal justice responses on various levels. Agencies rely on data from sources like the FBI’s Uniform Crime Reporting program to benchmark and strategically adjust their efforts. This kind of detailed analysis contributes to a clearer understanding of where South Carolina stands and where targeted action might be needed.
| Violent Crime Type | South Carolina Rate | National Median Rate |
|---|---|---|
| Murder | 0.09 | 0.06 |
| Rape | 0.36 | 0.38 |
| Robbery | 0.39 | 0.67 |
| Assault | 3.86 | 2.64 |
Insights into Property Crime in South Carolina
The bulk of crime in South Carolina comes from property crime, which greatly affects people’s belongings and feelings of security. Among these offenses, theft stands out as the most common, with over 86,000 cases reported. The chances of any resident falling victim to property crime stand at about 1 in 46, emphasizing the need for effective law enforcement and preventive strategies.
Other notable property-related crimes include burglary and motor vehicle theft, both influencing neighborhood safety and local economies. These figures highlight a critical area for enhancing public safety and strengthening community trust. Carefully analyzing and responding to these trends supports better protection against loss and damage across South Carolina.
| Property Crime Type | Reported Cases | Rate per 1,000 Residents |
|---|---|---|
| Burglary | 17,263 | 3.21 |
| Theft | 86,930 | 16.18 |
| Motor Vehicle Theft | 13,653 | 2.54 |
Property Crime Rate Comparison Between South Carolina and U.S.
Comparing the property crime rates between South Carolina and the national averages offers deeper insights into where the state stands. While rates for burglary and theft in South Carolina are higher than the national median, motor vehicle theft is slightly less common. These contrasts reveal specific vulnerabilities and strengths in the state’s crime environment. Understanding these differences informs resource allocation and law enforcement priorities. For a broader perspective, statistical reports like those available at the Bureau of Justice Statistics provide valuable context and trend analyses to support ongoing improvement in public safety.
| Property Crime Type | South Carolina Rate | National Median Rate |
|---|---|---|
| Burglary | 3.21 | 2.51 |
| Theft | 16.18 | 13.47 |
| Motor Vehicle Theft | 2.54 | 3.19 |
Crime Density Metrics in South Carolina
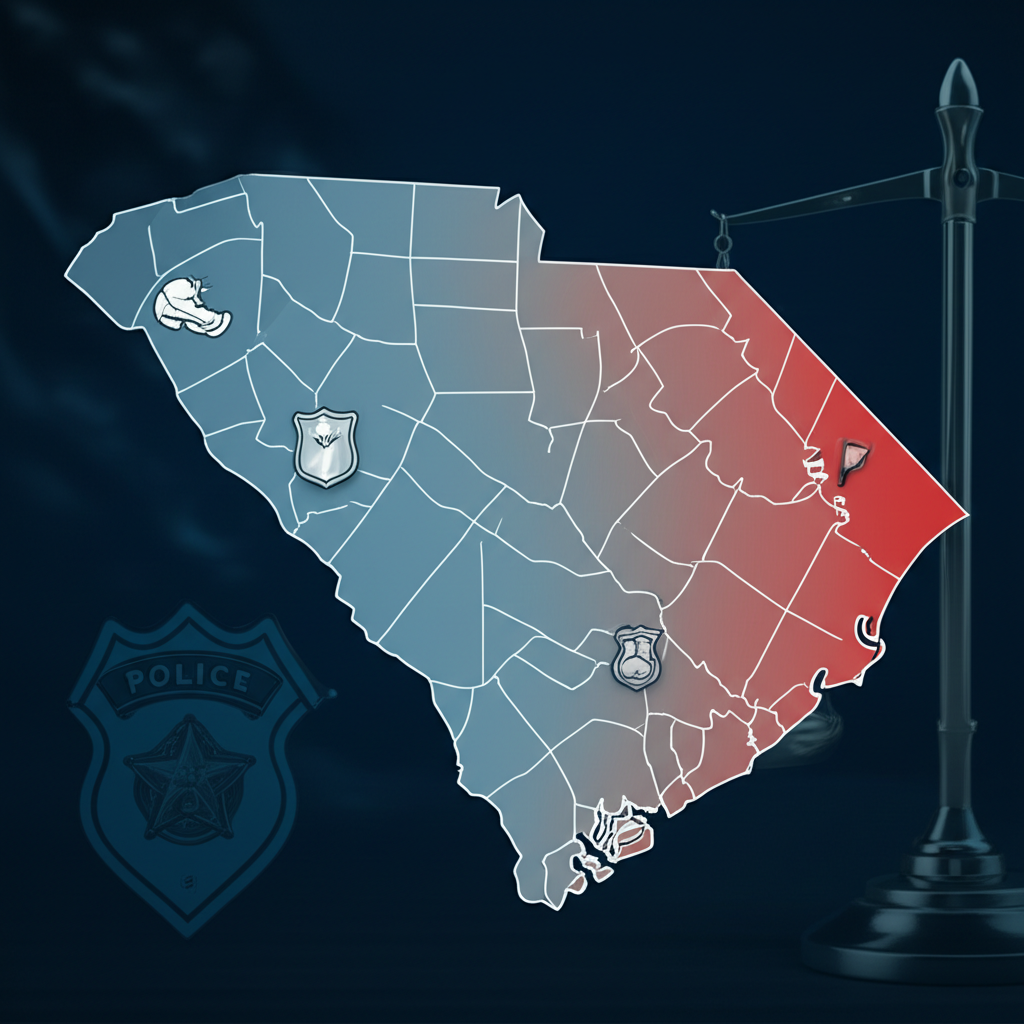
Looking beyond raw numbers, the concept of crime density—how many crimes occur per square mile—offers useful insights. South Carolina reports about 27 crimes per square mile, marginally higher than the national median of 26.5. This higher density often aligns with population patterns and urban development factors. Areas with more concentrated populations tend to experience different crime dynamics compared to rural zones. Law enforcement agencies use these metrics to plan patrols and safety initiatives effectively. Ultimately, analyzing crime density helps enhance decision-making about protecting communities and allocating resources to maximize impact.
| Location | Crimes per Square Mile |
|---|---|
| South Carolina | 27 |
| National Median | 26.5 |
Top Safest Cities in South Carolina
South Carolina is home to many communities where public safety thrives. Among them, Daufuskie Island stands out as the safest city in the state, providing a peaceful environment for its residents. Other cities like Jenkinsville, Bradley, and Coward also rank highly for their low crime levels. These places reflect effective crime prevention measures, strong community safety culture, and active support from law enforcement. Such cities contribute positively to overall well-being and offer examples of how collaborative efforts between social institutions and residents can build trust and security.
| Rank | City |
|---|---|
| 1 | Daufuskie Island |
| 2 | Jenkinsville |
| 3 | Bradley |
| 4 | Coward |
| 5 | McBee |
| 6 | Windsor |
| 7 | Lodge |
| 8 | Fingerville |
| 9 | Cope |
| 10 | Little Mountain |
Popular Cities in South Carolina and Crime Data
South Carolina boasts a range of popular cities that vary greatly in size, culture, and safety profiles. Places like Charleston, Columbia, Greenville, and Myrtle Beach attract many residents and visitors alike. Detailed crime information for these urban areas remains crucial for local authorities and social research groups that focus on improving public safety. While specific crime data may not always be immediately available for every city, understanding demographic and social factors helps shape policies and programs for better community protection. These dynamic urban centers show the diverse nature of challenges and opportunities in the state’s fight against crime.
| City | Crime Data Availability |
|---|---|
| Bluffton | [city_crime_row city=”Bluffton” state=”South Carolina”] |
| Charleston | [city_crime_row city=”Charleston” state=”South Carolina”] |
| Columbia | [city_crime_row city=”Columbia” state=”South Carolina”] |
| Florence | [city_crime_row city=”Florence” state=”South Carolina”] |
| Goose Creek | [city_crime_row city=”Goose Creek” state=”South Carolina”] |
| Greenville | [city_crime_row city=”Greenville” state=”South Carolina”] |
| Greer | [city_crime_row city=”Greer” state=”South Carolina”] |
| Hilton Head Island | [city_crime_row city=”Hilton Head Island” state=”South Carolina”] |
| Mount Pleasant | [city_crime_row city=”Bluffton” state=”South Carolina”] |
| Myrtle Beach | [city_crime_row city=”Mount Pleasant” state=”South Carolina”] |
| North Charleston | [city_crime_row city=”North Charleston” state=”South Carolina”] |
| Rock Hill | [city_crime_row city=”Rock Hill” state=”South Carolina”] |
| Spartanburg | [city_crime_row city=”Spartanburg” state=”South Carolina”] |
| Summerville | [city_crime_row city=”Summerville” state=”South Carolina”] |
| Sumter | [city_crime_row city=”Sumter” state=”South Carolina”] |
Crime Data Collection Methodology and Sources
The quality and reliability of crime data depend heavily on how it is collected and analyzed. National efforts draw information from roughly 18,000 local law enforcement agencies across the United States. This comprehensive scope ensures that varying crime patterns are captured accurately. Data updates occur annually, with the latest release reflecting the previous calendar year’s offenses.

The methodology involves a complex meta-analysis of millions of reports and includes geospatial data to enhance understanding of crime spread and density. These official statistics provide essential guidance for criminology experts, statisticians, and policymakers focused on strengthening public safety. For more on data sources and methods, the Bureau of Justice Statistics offers extensive resources.
- Crime data compiled from approximately 18,000 local law enforcement agencies across the U.S.
- Annual updates ensure data relevance and accuracy for policy and law enforcement use.
- Methodology involves meta-analysis of millions of reported crimes, including geospatial data integration.
Conclusion
In wrapping up our in-depth analysis of South Carolina’s crime rate, it’s clear that the state faces significant challenges in addressing both violent and property crimes. The crime statistics reveal a complex interplay of social issues, law enforcement strategies, and criminal justice responses. Violence, particularly in the form of assault and murder, alongside property crimes like theft and burglary, underscores the need for comprehensive public safety measures.
The role of criminal law and the effectiveness of legal action in combating these crimes are pivotal. Moreover, the data highlights the importance of addressing underlying social issues and gender-related prejudices that contribute to crime. Efforts to enhance public safety must also consider the broader societal impacts, including the need for emergency services and the protection of human rights.
South Carolina’s crime landscape calls for a multidisciplinary approach, integrating criminology, social research, and public policy to foster a safer community. The statistical data sets and official statistics provided offer a foundation for ongoing analysis and action. As we move forward, the collective efforts of law enforcement, policymakers, and the community will be crucial in reducing crime rates and ensuring justice for all residents.

